| Demographics of the Republic of Soigá | |
|---|---|
| PopSoigá.png Population Soigá from 1884 to 2016 | |
| Population: | 3,983,394 (2016 census) |
| Density: | 117.8 per sq km |
| Growth rate: | -3.3‰ (2016 census) |
| Birth rate: | 9.6 per thousand inhabitants (2016 census) |
| Death rate: | 13.1 per thousand inhabitants (2016 census) |
| Life expectancy: | 77.1 years |
| –male: | 75.0 years |
| –female: | 79.1 years |
| Fertility rate: | 1.51 (2016 census) |
| Infant mortality rate: | 4.0 per 1,000 live births (2016 census) |
| Net migration rate: | 0.2 per 1,000 inhabitants (2016 census) |
| Age structure | |
| 0-14 years: | 14.70% (2016 census) |
| 15-64 years: | 65.96% (2016 census) |
| 65-over: | 19.34% (2016 census) |
| Sex ratio | |
| Total: | 0.962 males per female |
| At birth: | 1.077 males per female |
| Under 15: | 1.056 males per female |
| 15-64 years: | 1.008 males per female |
| 65-over: | 0.734 males per female |
| Nationality | |
| Major ethnic: | Soigan (92%) |
| Minor ethnic: | Spanish (2.47%) Polish (0.64%) Romanian (0.53%) Maruiqi (0.50%) |
| Language | |
| Official: | Olfkin |
| Spoken: | Olfkin (96%) Spanish (0.8%) |
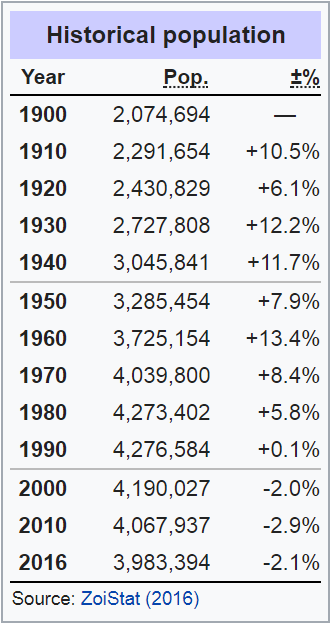
Soigá possesses an interesting demographic history, as Soigá (the island) itself was one of the last major landmasses to be settled. Only around 1000 BC first human structures/artifacts can be found on the island. Currently nearly 4 million people live in the country, however the last three decades Soigá has been hovering around the 4 million inhabitants, after quick growth in the mid century. Life expectancy more than doubled: from 32 years in 1900 to 77.1 years in 2016. Infant mortality has decreased rapidly, from roughly 22% of all born babies not surviving their first year in 1900, to less than 0.4% in 2016. Birth rates have however also decreased dramatically, from more than 6 children a woman at the start of the 20th century to just about 1.16 in 2001. Since then the birth rates have increased a bit. The country is also aging, with for every 10 born children, 15 people are entering the 65 or plus age bracket. The median age has skyrocketed in the second half of the 20th century: in 1900, 50% of the population was 19 or younger, in 1950, this had only slightly increased to about 24 years; in 2016 this was 44 years.
Demographic history[]
According to DNA analysis, the first settlers of the island did not number more than around 800 people. What drove them to cross the sea is still not known, but according to the myth the Soigan people crossed the sea because they were followed by an evil tribe called the Hietorans. There has been evidence of boats used to cross or sail rivers in Galicia before the time the Soigans crossed the sea, giving support to the theory that they were capable of sea-traveling.
In the year 122 AD the Roman writer Justinus Ascelinus said that the province of Aurealis (Soigá) was a "sparsely populated province" with "not more than a dozen thousand people". The population of Soigá in the year 1 AD is estimated to be around 50 thousand people, indicating a much higher growth rate than the average of the world (the world's population roughly tripled between 1000 BC and 1 AD). Several theories have been put forward to explain this rapid growth. The most accepted theory is that, due to no other population living in Soigá, there was no competition, which was even bolstered by the fact that the 800 people split up and settled at different places in Soigá. In order to cultivate and live on the island an even greater need for more children was there, and since the grounds of Soigá are fertile, enough food could be produced. Life expectancy also rose since there was no competition and more than enough food. This led the population to explode: not even in industrial modern Soigá these population growth rates could be achieved again. The population growth rate likely decreased by time, as more and more people meant more and more competition for food and resources, and in the last half of the 1000 BC - 1 AD millenium wars and conflicts became common. The growth rate started to equalize with the world's one.
The population of Soigá grew compared to the former millenium much slower in the 1st millenium: by just more than 2x. In Roman times it received an influx of Roman immigrants, but it also suffered from wars and many young men were used as mercenaries in the Roman army, often not surviving to go back home. Unlike many other places in Europe, Soigá did not properly enter the Medieval Age before the year 1000 AD, as before it was still a very tribal non-Christian country. Urban centres started to grow in size at the start of the 2nd millenium: Makán started to become already the largest city with around 17,000 inhabitants in 1250. The High Middle Ages (1000 AD to around 1350 AD) were a time of steady and prosperous growth, nearly doubling from 1000 AD to 1350 AD. However, like in many places in Europe, the Death Plague ravaged through the population at the end of the era. The bubonic plague likely entered Soigá on a trade ship in a port town, possibly Makán. An estimated 25% of the population that was alive at the time died because of the bubonic plague. The population however did pick up growth again and an estimated 210 thousand people lived on the island at the start of the 16th century.
In the Hofátur-Bilenzú era (roughly from 1500 to 1650) the population grew quick. New goods from all over the world gave the people various ways for getting their (and more) nutritients, and increased trade meant greater wealth. Towns and cities, which were previously often extremely filthy, were more sanitated thanks to the extra wealth, leading to an increase in life expectancy. However, the fall of the Hofátur-Bilenzú era, leading to the Dark Century of Soigá (1645 to 1733), made the population growth rates fall rapidly.

Population of Soigá (1500-2016). Figures till 1884 are estimates, beyond that are figures from government statistics (censusses and more).
Between 1800 and 1900, Soigá was lagging far behind in industralisation compared to other European countries: the situation was so bad that nearly every second child would not be able to see his/her 5th birthday. Soigá was as well plagued by crisises in the 19th century (the most infamous one being the Padoor War), its economy being drained and losing most of its international power. This delayed the progress for industrialisation severely. King Hálámír tried to industrialize the country, and although death rates eventually started to fall at the end of the century, massive emigration had occured, effectively making the extra growth void. It has been calculated that Soigá's population would have been about 6.6 million in 2016 if there would have been no migrants from 1884 to 2016. Under King Hálámír's rule, roughly 900,000 had left the country.
The 20th century was marked by a huge increase in life expectancy and therefore large decline in mortality rates. The population growth started to kick off especially when the Communists got in power. The population grew from the census of 1932 (2,784,361 people) to the census of 1981 (4,290,449) with 54%. This rapid growth was realised by the Communists by making health care universal for everyone and better health care in general. Large sanitation programs were started, as well as large projects to industrialize Soigá, making it modern. Great leaps were made, and between 1920 and 1980, life expectancy increased from 39 years to 68 years. This was one of the many reasons the age 1943 to 1980 were called The Golden Age of the Second Communist Republic.
The Cigarette's Crisis, which occured in 1980, slowed down progress severely, which is also seen in the population growths: birth rates dramatically fell. In 1976 there were roughly 70 thousand births, but in 2012, when the number of anuual births was the lowest, there were just 36,000 births annually, a reduction of nearly 50%. The crisis eventually became the demise for the Second Communist Republic. After a small rise in birth rate in the early 2000's, birth rates fell again due to the effects of the Crisis of 2008. Since 2012, birth rates have gone upwards again, but not by much. The falling birth rates including emigration have made the population fall with nearly 10% compared to its level in 1983.
Vital statistics[]
This is a table with the vital statistics of the population of Soigá from 1900 to 2016. The population, births and deaths are enumerated to 31rd of December of that year. Not given here is the net migrant rate, which had significant effect on the population of Soigá (as given above, the population of Soigá without migration since 1884 would have been more than 6.6 million). The Total Fertility Rate (TFR, the hypothetical number of children a woman would get in her lifetime if the fertility rates for every age in that year would be constant during her childbearing time) is given for 1945 and after. Note that the post war baby boom started earlier in Soigá compared to other nations as Soigá was liberated earlier.
There are some spikes in death rates, namely in the First World War (1914-1918), when King Hálámír had sent 220,000 men to the front as he feared a powerful protestant Germany controlling the power balances in Catholic south Europe. Of these 220,000 men, roughly 40 thousand died. Birth rates also diminished since future fathers were at the front and thus couldn't get children. Between 1941 and 1943, there were roughly another 20 to 30 thousand deaths with the invasion of Nazi Germany and its subsequent puppet regime (Fascist Soigá under leadership of Máríjöz Netíles) till 1943, when Communists could topple the regime.
After 1980, birth rates declined rapidly, as the result of the Cigarette's Crisis. Experts say that the Crisis was the inevitable cause of the Soigan Revolution, which happened between 1981 and 1982.
Death rates are relatively high (13+), since the highly populous age cohorts between 1920 and 1960 are dying off. On average per year there were 150% more births than there are now. For example, the year 1921 was the year with the highest number of babies born in Soigá ever: 107 thousand. Compare that to the nowadays number of below 40 thousand.
| Year | Population
(1000x) |
Live births | Deaths | Natural change | Crude birth rate (per 1000) | Crude death rate (per 1000) | Natural change rate (per 1000) | TFR |
|---|---|---|---|---|---|---|---|---|
| 1900 | 2 075 | 97 069 | 63 797 | 33 272 | 46.8 | 30.7 | 16.1 | |
| 1901 | 2 093 | 99 233 | 62 024 | 37 209 | 47.4 | 29.6 | 17.8 | |
| 1902 | 2 112 | 98 388 | 60 960 | 37 428 | 46.6 | 28.9 | 17.7 | |
| 1903 | 2 131 | 100 195 | 62 615 | 37 580 | 47.0 | 29.4 | 17.6 | |
| 1904 | 2 150 | 100 677 | 63 168 | 37 509 | 46.8 | 29.4 | 17.4 | |
| 1905 | 2 171 | 100 565 | 62 381 | 38 184 | 46.3 | 28.7 | 17.6 | |
| 1906 | 2 192 | 99 712 | 60 735 | 38 977 | 45.5 | 27.7 | 17.8 | |
| 1907 | 2 215 | 102 384 | 61 290 | 41 094 | 46.2 | 27.7 | 18.5 | |
| 1908 | 2 238 | 102 427 | 61 465 | 40 962 | 45.8 | 27.5 | 18.3 | |
| 1909 | 2 266 | 104 678 | 60 343 | 44 335 | 46.2 | 26.6 | 19.6 | |
| 1910 | 2 292 | 102 926 | 60 174 | 42 752 | 44.9 | 26.3 | 18.6 | |
| 1911 | 2 314 | 101 963 | 61 243 | 40 720 | 44.1 | 26.5 | 17.6 | |
| 1912 | 2 335 | 100 208 | 60 462 | 39 746 | 42.9 | 25.9 | 17.0 | |
| 1913 | 2 357 | 99 073 | 58 168 | 40 905 | 42.0 | 24.7 | 17.3 | |
| 1914 | 2 378 | 98 731 | 58 101 | 40 630 | 41.5 | 24.4 | 17.1 | |
| 1915 | 2 377 | 80 290 | 62 020 | 18 270 | 33.8 | 26.1 | 7.7 | |
| 1916 | 2 382 | 84 472 | 60 463 | 24 009 | 35.5 | 25.4 | 10.1 | |
| 1917 | 2 386 | 83 765 | 60 353 | 23 412 | 35.1 | 25.3 | 9.8 | |
| 1918 | 2 391 | 81 529 | 58 611 | 22 918 | 34.1 | 24.5 | 9.6 | |
| 1919 | 2 398 | 85 960 | 59 913 | 26 047 | 35.8 | 25.0 | 10.8 | |
| 1920 | 2 431 | 106 538 | 55 282 | 51 256 | 43.8 | 22.7 | 21.1 | |
| 1921 | 2 463 | 107 320 | 56 513 | 50 807 | 43.6 | 22.9 | 20.7 | |
| 1922 | 2 493 | 105 207 | 56 279 | 48 928 | 42.2 | 22.6 | 19.6 | |
| 1923 | 2 522 | 104 274 | 56 903 | 47 371 | 41.3 | 22.6 | 18.7 | |
| 1924 | 2 551 | 104 173 | 56 582 | 47 591 | 40.8 | 22.2 | 18.6 | |
| 1925 | 2 579 | 103 015 | 56 286 | 46 729 | 39.9 | 21.8 | 18.1 | |
| 1926 | 2 610 | 104 411 | 55 803 | 48 608 | 40.0 | 21.4 | 18.6 | |
| 1927 | 2 638 | 102 359 | 55 934 | 46 425 | 38.8 | 21.2 | 17.6 | |
| 1928 | 2 668 | 104 250 | 56 121 | 48 129 | 39.1 | 21.0 | 18.1 | |
| 1929 | 2 698 | 101 174 | 52 313 | 48 861 | 37.5 | 19.4 | 18.1 | |
| 1930 | 2 728 | 100 311 | 52 805 | 47 506 | 36.8 | 19.4 | 17.4 | |
| 1931 | 2 755 | 100 204 | 54 815 | 45 389 | 36.4 | 19.9 | 16.5 | |
| 1932 | 2 784 | 99 687 | 52 533 | 47 154 | 35.8 | 18.9 | 16.9 | |
| 1933 | 2 815 | 102 043 | 53 582 | 48 461 | 36.3 | 19.0 | 17.3 | |
| 1934 | 2 843 | 101 261 | 55 357 | 45 904 | 35.6 | 19.5 | 16.1 | |
| 1935 | 2 871 | 99 257 | 53 273 | 45 984 | 34.6 | 18.6 | 16.0 | |
| 1936 | 2 898 | 97 107 | 52 783 | 44 324 | 33.5 | 18.2 | 15.3 | |
| 1937 | 2 938 | 102 191 | 51 984 | 50 207 | 34.8 | 17.7 | 17.1 | |
| 1938 | 2 975 | 97 542 | 50 669 | 46 873 | 32.8 | 17.0 | 15.8 | |
| 1939 | 3 010 | 95 226 | 50 375 | 44 851 | 31.6 | 16.7 | 14.9 | |
| 1940 | 3 046 | 92 002 | 46 774 | 45 228 | 30.2 | 15.4 | 14.8 | |
| 1941 | 3 076 | 85 385 | 45 951 | 39 434 | 27.8 | 14.9 | 12.9 | |
| 1942 | 3 075 | 64 163 | 56 288 | 7 875 | 20.9 | 18.3 | 2.6 | |
| 1943 | 3 074 | 69 134 | 60 863 | 8 271 | 22.5 | 19.8 | 2.7 | |
| 1944 | 3 082 | 68 252 | 51 662 | 16 590 | 22.1 | 16.8 | 5.3 | |
| 1945 | 3 121 | 92 191 | 44 589 | 47 602 | 29.5 | 14.3 | 15.2 | 3.82 |
| 1946 | 3 156 | 87 683 | 44 493 | 43 190 | 27.8 | 14.1 | 13.7 | 3.59 |
| 1947 | 3 186 | 81 164 | 43 536 | 37 628 | 25.5 | 13.7 | 11.8 | 3.28 |
| 1948 | 3 215 | 81 758 | 44 501 | 37 257 | 25.4 | 13.8 | 11.6 | 3.26 |
| 1949 | 3 249 | 86 576 | 45 215 | 41 361 | 26.6 | 13.9 | 12.7 | 3.41 |
| 1950 | 3 285 | 89 769 | 46 511 | 43 258 | 27.3 | 14.2 | 13.1 | 3.48 |
| 1951 | 3 321 | 88 261 | 45 528 | 42 733 | 26.6 | 13.7 | 12.9 | 3.39 |
| 1952 | 3 362 | 93 769 | 46 065 | 47 704 | 27.9 | 13.7 | 14.2 | 3.55 |
| 1953 | 3 403 | 92 797 | 45 328 | 47 469 | 27.3 | 13.3 | 14.0 | 3.48 |
| 1954 | 3 447 | 95 976 | 45 855 | 50 121 | 27.8 | 13.3 | 14.5 | 3.56 |
| 1955 | 3 495 | 97 011 | 43 890 | 53 121 | 27.8 | 12.6 | 15.2 | 3.56 |
| 1956 | 3 544 | 99 581 | 44 620 | 54 961 | 28.1 | 12.6 | 15.5 | 3.62 |
| 1957 | 3 593 | 99 172 | 44 260 | 54 912 | 27.6 | 12.3 | 15.3 | 3.57 |
| 1958 | 3 639 | 93 140 | 42 544 | 50 596 | 25.6 | 11.7 | 13.9 | 3.32 |
| 1959 | 3 686 | 94 919 | 43 122 | 51 797 | 25.8 | 11.7 | 14.1 | 3.36 |
| 1960 | 3 725 | 86 667 | 42 448 | 44 219 | 23.3 | 11.4 | 11.9 | 3.05 |
| 1961 | 3 761 | 82 348 | 42 461 | 39 887 | 21.9 | 11.3 | 10.6 | 2.85 |
| 1962 | 3 793 | 78 171 | 41 322 | 36 849 | 20.6 | 10.9 | 9.7 | 2.67 |
| 1963 | 3 829 | 82 336 | 42 475 | 39 861 | 21.5 | 11.1 | 10.4 | 2.77 |
| 1964 | 3 863 | 78 089 | 40 788 | 37 301 | 20.2 | 10.6 | 9.6 | 2.59 |
| 1965 | 3 893 | 73 610 | 39 868 | 33 742 | 18.9 | 10.2 | 8.7 | 2.41 |
| 1966 | 3 924 | 73 204 | 39 759 | 33 445 | 18.7 | 10.1 | 8.6 | 2.39 |
| 1967 | 3 955 | 72 855 | 39 238 | 33 617 | 18.4 | 9.9 | 8.5 | 2.38 |
| 1968 | 3 987 | 73 406 | 39 181 | 34 225 | 18.4 | 9.8 | 8.6 | 2.39 |
| 1969 | 4 014 | 67 249 | 38 400 | 28 849 | 16.8 | 9.6 | 7.2 | 2.18 |
| 1970 | 4 040 | 66 484 | 38 917 | 27 567 | 16.5 | 9.6 | 6.9 | 2.14 |
| 1971 | 4 061 | 61 261 | 38 753 | 22 508 | 15.1 | 9.5 | 5.6 | 1.97 |
| 1972 | 4 084 | 61 795 | 38 546 | 23 249 | 15.1 | 9.4 | 5.7 | 1.98 |
| 1973 | 4 107 | 63 883 | 39 738 | 24 145 | 15.6 | 9.7 | 5.9 | 2.04 |
| 1974 | 4 131 | 62 471 | 38 905 | 23 566 | 15.1 | 9.4 | 5.7 | 1.99 |
| 1975 | 4 158 | 66 952 | 39 435 | 27 517 | 16.1 | 9.5 | 6.6 | 2.12 |
| 1976 | 4 188 | 69 774 | 40 011 | 29 763 | 16.7 | 9.6 | 7.1 | 2.19 |
| 1977 | 4 211 | 62 271 | 39 511 | 22 760 | 14.8 | 9.4 | 5.4 | 1.95 |
| 1978 | 4 233 | 61 577 | 39 112 | 22 465 | 14.5 | 9.2 | 5.3 | 1.92 |
| 1979 | 4 252 | 57 689 | 39 231 | 18 458 | 13.6 | 9.2 | 4.4 | 1.80 |
| 1980 | 4 273 | 61 499 | 39 760 | 21 739 | 14.4 | 9.3 | 5.1 | 1.91 |
| 1981 | 4 290 | 56 985 | 39 938 | 17 047 | 13.3 | 9.3 | 4.0 | 1.77 |
| 1982 | 4 304 | 53 213 | 40 092 | 13 121 | 12.4 | 9.3 | 3.1 | 1.64 |
| 1983 | 4 310 | 47 226 | 40 469 | 6 757 | 11.0 | 9.4 | 1.6 | 1.46 |
| 1984 | 4 301 | 43 489 | 40 740 | 2 749 | 10.1 | 9.5 | 0.6 | 1.35 |
| 1985 | 4 296 | 48 940 | 41 830 | 7 110 | 11.4 | 9.7 | 1.7 | 1.52 |
| 1986 | 4 289 | 47 669 | 42 518 | 5 151 | 11.1 | 9.9 | 1.2 | 1.48 |
| 1987 | 4 281 | 46 370 | 42 392 | 3 978 | 10.8 | 9.9 | 0.9 | 1.43 |
| 1988 | 4 280 | 50 594 | 42 089 | 8 505 | 11.8 | 9.8 | 2.0 | 1.53 |
| 1989 | 4 278 | 51 633 | 42 677 | 8 956 | 12.1 | 10.0 | 2.1 | 1.54 |
| 1990 | 4 277 | 52 239 | 42 235 | 10 004 | 12.2 | 9.9 | 2.3 | 1.53 |
| 1991 | 4 268 | 45 491 | 42 506 | 2 985 | 10.7 | 10.0 | 0.7 | 1.34 |
| 1992 | 4 259 | 45 113 | 42 324 | 2 789 | 10.6 | 9.9 | 0.7 | 1.33 |
| 1993 | 4 255 | 49 986 | 42 903 | 7 083 | 11.7 | 10.1 | 1.6 | 1.46 |
| 1994 | 4 247 | 45 965 | 43 070 | 2 895 | 10.8 | 10.1 | 0.7 | 1.34 |
| 1995 | 4 242 | 50 136 | 43 462 | 6 674 | 11.8 | 10.2 | 1.6 | 1.46 |
| 1996 | 4 232 | 43 271 | 43 644 | -373 | 10.2 | 10.3 | -0.1 | 1.27 |
| 1997 | 4 219 | 41 780 | 44 448 | -2 668 | 9.9 | 10.5 | -0.6 | 1.22 |
| 1998 | 4 212 | 46 830 | 45 138 | 1 692 | 11.1 | 10.7 | 0.4 | 1.39 |
| 1999 | 4 202 | 43 230 | 44 914 | -1 684 | 10.3 | 10.7 | -0.4 | 1.29 |
| 2000 | 4 190 | 41 721 | 44 674 | -2 953 | 10.0 | 10.7 | -0.7 | 1.26 |
| 2001 | 4 174 | 37 849 | 44 778 | -6 929 | 9.1 | 10.7 | -1.6 | 1.16 |
| 2002 | 4 160 | 39 271 | 44 956 | -5 685 | 9.4 | 10.8 | -1.4 | 1.24 |
| 2003 | 4 144 | 37 479 | 45 456 | -7 977 | 9.0 | 11.0 | -2.0 | 1.21 |
| 2004 | 4 132 | 39 533 | 46 313 | -6 780 | 9.6 | 11.2 | -1.6 | 1.30 |
| 2005 | 4 121 | 41 463 | 47 175 | -5 712 | 10.1 | 11.4 | -1.3 | 1.40 |
| 2006 | 4 113 | 43 598 | 48 077 | -4 479 | 10.6 | 11.7 | -1.1 | 1.50 |
| 2007 | 4 103 | 42 264 | 48 104 | -5 840 | 10.3 | 11.7 | -1.4 | 1.48 |
| 2008 | 4 094 | 42 859 | 48 343 | -5 484 | 10.5 | 11.8 | -1.3 | 1.52 |
| 2009 | 4 082 | 40 515 | 49 292 | -8 777 | 9.9 | 12.1 | -2.2 | 1.46 |
| 2010 | 4 068 | 39 140 | 49 538 | -10 398 | 9.6 | 12.2 | -2.6 | 1.43 |
| 2011 | 4 053 | 37 134 | 49 831 | -12 697 | 9.2 | 12.3 | -3.1 | 1.38 |
| 2012 | 4 037 | 35 887 | 50 338 | -14 451 | 8.9 | 12.5 | -3.6 | 1.35 |
| 2013 | 4 022 | 37 610 | 51 242 | -13 632 | 9.4 | 12.7 | -3.3 | 1.44 |
| 2014 | 4 010 | 38 999 | 51 602 | -12 603 | 9.7 | 12.9 | -3.2 | 1.52 |
| 2015 | 3 997 | 39 247 | 51 855 | -12 608 | 9.8 | 13.0 | -3.2 | 1.54 |
| 2016 | 3 983 | 38 060 | 52 117 | -14 057 | 9.6 | 13.1 | -3.5 | 1.51 |
| 2017 | 3 972 | 38 094 | 51 871 | -13 777 | 9.6 | 13.1 | -3.5 | 1.52 |
Collection of data about the population[]
Data about the population from before the censusses is scarce and often either not reliable or representative of the entire population. Many rural births and deaths were unregistrated. Often, only parish records or cemetary stones provide data. Some cities however did have a data register. With the start of censusses, births and deaths occuring since 1885 have been recorded, although accuracy and complete coverage improved over the years.
Manfíl Coxeraz[]
A specific case which illustrates the lack of data before the censusses is Manfíl Coxeraz. Coxeraz (died in 1998) claimed he was born on "first of the Spring" 1871, which would make him 127 years at the time of his death and five years older then the current claimant for oldest person ever (Jeanne Calment, 122 years). Coxeraz claimed he fought in the Padoor War, fighting in the King's Army, and killing three rebels. There are "evidences" for his case. Firstly, a local parish has a record (in the church in his birth village) of a certain "Manfílus" being baptised 19th of March 1871. Secondly, Coxeraz often showed a picture to journalists depicting supposedly him (with moustache), with "1893" marked right under in the picture (with a rifle, as he supposedly then fought in the army). Thirdly, the censusses of 1884, 1900 and 1908 show someone with the name "Vard Manfíl Coxeraz" with birth year estimates of 1870 (censusses of 1884 and 1908) and 1875 (census of 1900). At the time, people who didn't had a birth certificate had a birth year estimate given by the census takers. Finally, in the fascist times (1941 to 1943) police records show a picture of Coxeraz (which has been proven to actually be Coxeraz), with a note: "Mr. Coxeraz is 70 years of age".
Counter arguments are as well present. In 2002 a tombstone was found in a village, not far from the village recalled by Coxeraz, with it being from a certain Vard Manfíl Coxeraz. This Coxeraz lived from 1870 to 1974 (and thus living an unusual long life as well). Some suspect that this is the same Coxeraz that was documentated in the parish record as well as in the censusses. The theory goes deeper: an administrative mistake could have happened, which could have caused the description belonging to this Coxeraz getting the picture of the Coxeraz who died in 1998. A notable point is that Manfíl Coxeraz (died 1998) never ever stated that his full name was Vard Manfíl Coxeraz, with "Vard" being crucial here. The person in the picture in the police file doesn't look 70 years either, being estimated to be in his forties (although centenarians can look young for their age). Journalist Migel Orádae stated that there is a reasonable chance that the Coxeraz who died in 1974 might even be the father or other close relative of the Coxeraz who died in 1998. The man in the picture dating back to 1893 might thus be the elder Coxeraz, with the younger Coxeraz, possibly because of age, confusing it with himself, as well as appointing the birthday of his father to himself. The photo then would be a family possesion.
The case Manfíl Coxeraz was a widespread and famous case in Soigá at the time. Many people believed he was the oldest person ever alive, with even him getting in children textbooks. His case is likely not an exception, and only with the introduction of mandatory birth registers became checking age claims more easy and accurate.
Reconstructing pre-census population[]
There have been attempts to reconstruct the population from before the censusses. One of those attempts has been done by professor Pátorús Sílompae. He had studied over 5,000 graves between the ages 1820 to 1880, and came to conclusion that infant mortality had increased during this time period, as well as life expectancy falling. Only after 1870, life expectancy grew again. He said that the crude death rate of Soigá at the time must have been "well in the 30's, maybe even forty". With this he could make a model how not only relatively death rates increased, but as well the absolute number of deaths, with the assumption that relatively people were being buried at the same rate in the time period. He could then interfer the previous population: he estimated the population of Soigá around 1800 to be 1.3 million. Most other studies find a likewise number.
Censusses[]
Since 1884, Soigá has censusses. A total of 18 censusses have since happened (1884, 1900, 1908, 1916, 1924, 1932, 1948, 1955, 1961, 1974, 1981, 1986, 1991, 1996, 2001, 2006, 2011 and 2016), the most recent being in 2016, and the next one being planned for 2021. There are taken at the last week of the year. Since the beginning of censusses in 1884 by King Hálámír, the make up of them has not been much different: the recipient is asked for his/her sex, name, age (birth date is asked), status (married, divorced etc.), job, birth place, religion, nationality, plus several other questions. This doesn't mean there haven't been controversies: in communist times religion and ethnicity/nationality were removed, while in King Hálámír's age giving your religion status as something other than Catholic meant great risk for yourself, which made many non Catholics having themselves signed as Catholic in censusses. Thus, data about religion from that time from censusses is deemed unreliable by scientists.
The first census in 1884 gave a population of 2,061,859 people, in the most recent census of 2016, this number was 3,983,394, an increase of 93%.
Population forecast[]
The population of Soigá will likely further decrease, since the highly populous age cohorts between 1920 and 1960 are dying off. The crude death rate could reach up to 15 promille because of this in the future. Between 2020 and 2030, if birth rates will get to be more replacement level (Dr. Hásel calls a TFR of "atleast" 1.8 necessary), the population will likely stabilise. Depending on the change in TFR (Dr. Hásel analyzed simulations with a TFR between 1.5 and 2.0), the population of Soigá could be between 3.3 million to 3.8 million. Dr. Hásel includes this with the assumption that every year from now on, 4,000 net migrants will enter the country, including that the life expectancy will be around 83 to 84 years in 2050 and child mortality will further decline to only 1 child per 1,000 born that will die before his/her 5th birthday. The median age as well will keep on increasing, to a "possible 50 years". The population 65 years or older will increase with a significant margin, while the population 14 years or younger will be roughly steady or only experience a mild decline. This means there will be a strain on the working population, as it will relatively (but also absolutely) shrink, which will mean that one working individual will have to pay more taxes in order to keep the pension system alive.
The population with a different ethnicity than Soigan will be increased from about 8% in 2017 to about 15% in 2050. The population of Firrobatists will roughly double from 2016 to 2050, and relatively will see its numbers grow from 5.6% of the population in 2016 to 12.1% of the population in 2050. They already account for 14% of all births in 2017, in 2050 this could be 30% (could, as Firrobatists could uphold their current high birth rate, or not). Every religion except Catholicism, Protestantism and Judaism is expected to grow both absolutely and relatively speaking. Catholicism will lose its majority position (50% or more) in 2050. Protestants are likely to be overtaken by Firrobatists in terms of size. The population that is not affiliated (atheists, agnostics etc.) will increase to 35% of the population. Judaism is expected to decline because of the significant emigration to Israel and USA by Soigan jews.
Ethnicity[]
Soigá has always been home of various ethnoreligious peoples, and in modern time with globalisation and EU this has been augmented. The Spanish are by far the largest minority, nearly 4 times as numerous as the next largest minority, the Polish. The Spanish mostly came in the beginning of the 19th century, when Soigá was under Spanish control. The Spanish King tried to quickly "Hispanize" the country and have the many mines and factories run by Spanish. Spanish people came in masse to get the many available jobs. Although the rest of the 19th century was marked by some discrimination against the Spanish, in modern day, many are well integrated, with only about half speaking Spanish as mother tongue (the most Spanish people identify as Spanish purely because of heritage or proudness of).
There is a considerable share of EU-related immigration in Soigá: around 5% (~200,000 people) of the total population is from a different country in Europe than Soigá, as are the many Poles, Romanians and Bulgarians. There is also a considerable share of Portuguese, being a close country to Soigá. A large number of French, German, British, Dutch and Scandinavian expatriats live in Soigá.
However, possibly the most notable and well-known minority in Soigá are the Maruiqish. These fled from modern day Senegal around the 1850's to Soigá. Soigá had some trade ports there, but with the loss of those in the 19th century, the Maruiqish were seen as the long-time collabarateurs and thus were persecuted and often bluntly killed. They were brought over to Soigá by the thousands by Hífard Pešilek, who in the 1980's became a hero of the people, made immortal by Prime Minister Grezemír's speech that "All Soigans are Hifard". In the 1850's, a widespread believed myth was that the Maruiqish were the long ago "brother" of the "Olfan" tribes, split off from the Soigans when the Soigans crossed the Strait of Gibraltar. To this day there are still some people who pertain to this theory. As a result the Maruiqish where welcomed warm-hearthedly. Most Maruiqish have been well-integrated, and the 0.50% number only covers the Maruiqish who primarily identify as a Maruiqi. Up to 5% could have partial Maruiqi ancestry in Soigá. The Maruiqish are largely muslim, and distinct Maruiqish city quarters have come to exist in the large cities.
The quick growing economy of Soigá has not just attracted migrants from the European Union, but also from the Middle East, South & East Asia and from many other places. Minorities from all these regions (thus exluding Europe) total about 4%. Soigá however is an island, making it hard for a simple traveling migrant to reach it. The share of higher educated migrants compared to lower educated migrants is thus higher than say in Spain or the United States.
One study in 2013 revealed that one in eight children under 5 has atleast one parent with a recent migration background.
| Ethnicity | Population | Percentage |
|---|---|---|
| Soigan | 3,655,628 | 92.04% |
| Spanish | 98,195 | 2.47% |
| Polish | 25,519 | 0.64% |
| Romanian | 21,167 | 0.53% |
| Bulgarian | 8,211 | 0.21% |
| Other European | 46,768 | 1.18% |
| Maruiqi | 19,886* | 0.50% |
| North African or
Middle Eastern |
30,154** | 0.76% |
| South or East Asian | 32,231 | 0.81% |
| Sub-Saharan African | 20,607 | 0.52% |
| Other (incl. from Americas) | 13,380 | 0.34% |
*Could be up to 5% of the total population who has atleast partial Maruiqish ancestry.
**Excludes the near 15,000 refugees mainly from Iraq, Syria and Afghanistan.
Languages[]
By far the largest spoken language in Soigá is Olfkin. Olfkin is an isolate language, with Besteriran being a daughter language of it. Olfkin is spoken by around 96% of the population as first language. Many different dialects are spoken however, with an estimated 41% speaking as "mother tongue" a dialect instead of the formal Standard Olfkin (itself based on the Devernese dialect). See Dialects in Soigá for more information.
Spanish is the second largest spoken language in Soigá, with about 0.8% having it as first language. Then comes Polish (0.6%), Romanian (0.5%) and Portuguese (0.3%). Interesting to note is that nearly all Polish, Romanian, Portuguese etc. speak Polish, Romanian or Portuguese, but the Spanish don't speak nearly as uniformily Spanish. This is because the Spanish have been on average way longer in Soigá than the other minorities (since the early 1800's).
Second language proficiency is not as high as in other European countries, with about 39% saying they have atleast a "basic understanding" of another language. On average in Europe this is 54%. Of these 39%, the most spoken secondary languages are English and Spanish, with 63% (of the 39%) being able to speak basic English, and 27% basic Spanish. Other languages often learnt as a secondary language are French (16%), German (13%), Italian (7%), Portuguese (5%), Russian (4%), and Chinese (2%). Around 40% of the 39% says to be able to speak a tertiary language to a basic level.
Religion[]
See main article: Religion in Soigá
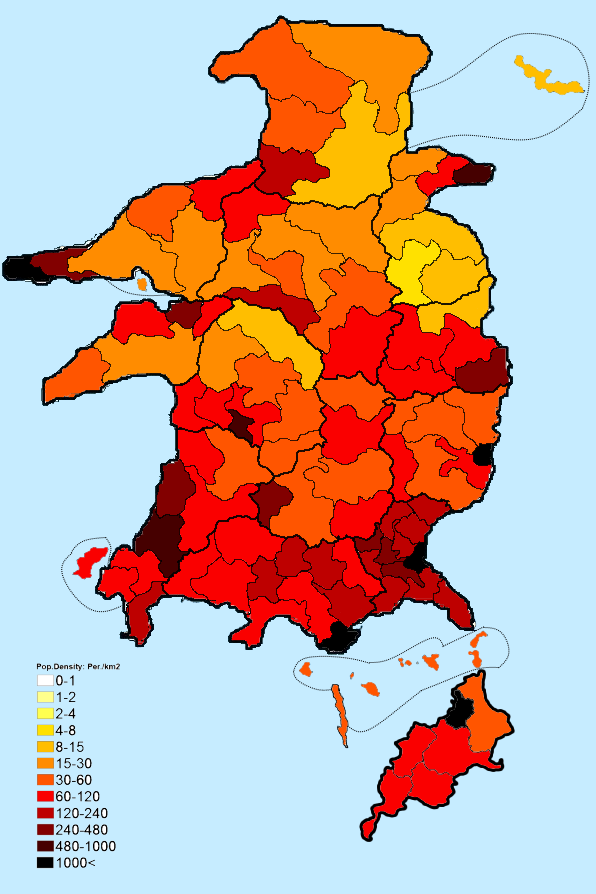
Population density[]
The population density of Soigá is 117.4 people per square km. However, the South is more densely populated than the North. For example, the Čonmíjan muncipality of Megódíjárid is larger than the regio of Deverná, but has only 2% of the population of Deverná. The three southern regios of Deverná, Mišömerá and Firečá account for half of the total population, but combined just one fifth of the total area. Although the regio of Čonmíjá (32.5 people per sq km) has a lower population density than Hárýpé (45.0 people per sq km), the population is more evenly distributed than that of Hárýpé. More than 60% of the total population of Hárýpé lives in the muncipality where Hönipreson is located. Logically, a Hárýpian muncipality has the lowest population density, namely Cöbádír, with 6.5 people per sq km.
Population density by muncipality (2016)
Total Fertility Rate[]
| Year | Total Fertility Rate
average estimate |
|---|---|
| 1880-1900 | 6.3 |
| 1900-1920 | 6.0 |
| 1920-1940 | 5.0 |
| 1940-1950 | 3.3 |
| 1950-1960 | 3.4 |
| 1960-1970 | 2.4 |
| 1970-1980 | 1.97 |
| 1980-1990 | 1.48 |
| 1990-2000 | 1.32 |
| 2000-2010 | 1.39 |
| 2016 | 1.51 |
The estimated total fertility rate (TFR) in Soigá is about 1.51 children per woman. This is considerably lower than the world's average of 2.36 and the natural replacement number of 2.10. It is more in line with other Western nations, like Spain (1.32), Italy (1.40) and Canada (1.61). However, this is an increase compared to previous years: in 2000, the TFR was just 1.16. Total fertility rates remained high until deep into the 20th century. The total fertility rate drasticly lowered after the Cigarette Crisis (1980). After 2000, increases were visible, but these were nulled by the Crisis of 2008. Now, total fertility rates have been climbing slowly but surely.
The cohort fertility rate says how many children a woman born in year x would actually get in her lifetime. For example, an average woman born in 1870 in Soigá would have beared 6 children if she had completed her childbearing age (conventionally from 15 to 45 years). An average woman born in 1900 would have had 5 children, while a woman born in 1945 would have beared two children. Now, women born in 1970 (who have completed their childbearing age in 2015) have had less than two children.
The replacement rate of 2.1 children a woman (to sustain the generation) has not always been the same. In short, the replacement rate says how many children a woman will have to bear to replace the generation (simply: "one for the mother, one for the father"). In 1900, this was 3.3 children, as roughly 40% of all children would have died before reaching childbearing age. In 1950, this was 2.6, while currently in 2017 it is estimated to be 2.014. This doesn't however take into account the number of children who will choose to not have children in their childbearing ages, plus the share that will (netto) migrate (there will be people leaving the country and going to the country of childbearing age). All this is in the assumption that mortality rates (for pre-childbearing age) will be the same over a timespan of 30 years.
The Total Fertility Rate is not equal among the different populations in Soigá. Firrobatists have the highest TFR, with roughly 3.5, while atheist Soigans in the South have the lowest with 1.2. The North has a somewhat higher TFR than the South, just as rural areas compared to urban areas. Immigrant populations have an higher TFR than the autochtonous population, with a TFR of roughly 1.8, although this ranges considerably depending on the country of origin.
Age[]
The Soigan age pyramid relatively reflects that of the average aging of the western world. The median age of Soigá is 43.8 years. With this Soigá is the 8th oldest country in the world. In 1950, the median age was just 24. This rapid aging was caused by the severely low birth rates that happened after the Cigarette Crisis. The percentage of youth (14 years or younger) is 14.7%, while the percentage of elderly people (65 years or older) is 19.3%. Compare this to the United States (19.0% and 14.8%), The Netherlands (16.5% and 18.2%), Italy (13.7% and 21.4%) and Japan (12.9% and 26.3%), for example. This in contrast with previous years: in the 1981 census, the youth population was 20.9% while the elderly population was 8.6%.


Timelapse of the age structure of Soigá, from 1901 to 2016, with each frame covering a 5-year period.
The average life expectancy in Soigá is 77.1 years. Although a bit lower than other nations in Western Europe, it is a lot higher than the world average of 71.0 years. The Soigan average life expectancy has more than doubled from 1900 to 2016 (from about 32 years). This is mainly due to the rapid decrease in child/infant mortality rate (the number of children dieing before their 5th or 1st, respectively, birthday per 1,000 live born per year). Around 1870, the infant mortality rate (IMR) was likely to be around the 280 (life expectancy was extremely low with an estimated 26 years). In 1900, the situation was improved, with the IMR declining to roughly 220. When the communists took control over Soigá with the First Socialist Republic of Soigá (1935-1941), the IMR was around 170. The IMR briefly increased with quite a large margin during the Second World War, reaching 190 at one point. This was because of the chaos the war brought to Soigá. In the Second Half of the IMR rapidly declined: in 1950 the IMR was 125, in 1980 this was 30. To this day the IMR keeps declining: it is estimated to be 4.0 in 2016.
Soigá also has a relatively high rate of centenarians (people 100 years or older): 20.5 centenarians per 100,000 people. There are 813 centenarians (147 males and 666 females) in Soigá. Currently Soigá has one supercentenarian (Tjorífíjá Kelásí, female, as of October 2017, 110 years old), but in total Soigá has had 10 supercentenarians (1 male, 9 female) since records began in 1884: the oldest person Soigá had was Lífílas Zoraigae, who died on 6th of May 2004, 113 years and 194 days of age (she was born 24th of October, 1890). At the time of her death, she was tied 9th oldest person to be alive, together with Maria do Couto Maia-Lopes from Portugal, both born in the same year and date. The oldest male Soigá had was Nígolaz Zecóbrímír, who was born 18th of April, 1901, and who died on 27th of August 2013, 112 years and 131 days old. He is the 30th oldest man to be ever alive, as of October 2017.
Women in Soigá get a child on average when they are 29.4 years. This is relatively later in one's life than in other nations on Earth, but it is more in line with other Western European countries.
Immigration/emigration[]
Extrapolated from the latest census, the current net migrant rate is 0.5 per thousand inhabitants. This is in contrast with the net migrant rate that Soigá had before entering the 3rd millenium, which was mainly negative. This is mainly due to the fast economy growth Soigá enjoyed in the late 90's and in the begin of the 21st century, and the shortage of labour caused many people from other countries in the EU to go to Soigá to find a job, mainly in infrastructure, renovation, building, agriculture and other hand labour. Before that, the Soigans themselves were emigrating to other nations in the EU to find work abroad. Poles have the largest presence from these labour migrating ethnicities, with 0.6% of the total Soigan population. This means more than 23,000 Poles work in Soigá. Besides the Poles Romanians (~19,000) and Bulgarians (~8,000) have large presences as well in Soigá, mainly in the large cities. In terms of minorities, the Poles are only overtaked by the Spanish.
According to data, around 235,000 people had immigrated to Soigá in the period 2001 to 2016. Meanwhile, in the same period, around 280,000 people had emigrated out of Soigá, mainly to other countries in Europe but as well as to the Americas, Oceania and Israel (mainly Sephardic Jews). This means on average per year around 15,670 immigrate to Soigá while 18,670 emigrate out of Soigá. This however takes out of consideration the nearly 25,000 refugees from mainly Syria and Iraq that were brought over to Soigá by prime minister Benúdá to relieve the refugee camps in the Balkan peninsula. These refugees were not counted in the censuses because only citizens and people who had a visa of some kind were counted. These refugees can however apply for Soigan citizenship.
Under communist rule it was hard to get abroad, and the net migrant rate was about -1 to -2, quite different from the years under King Hálámír when the net migrant rate was about -10. From 1974 to 1996 207,000 Soigans had emigrated out of Soigá. This was versus just 50,000 immigrants to Soigá. After the proclamation of the Republic the emigrant number started to rise again, especially when Soigá joined the EU. Economic improvement and succes caused the net migrant rate to increase in the 90's, and for the first time ever a positive net migrant rate was recorded in 2015.
The 19th century was a difficult century for Soigá, as the economic wealth was drained by crisises, crop fails and loss of colonial territory. This caused a major increase in emigration. Under King Halamír this was even more augmented, due to the heavy oppression minorities (Protestants, Firrobatists, Muslims, Jews) faced. Censuses were started under King Halamír in 1884, and using the data from the censuses plus estimations around 900 thousand emigrated out of Soigá under Halamír's reign (1877 to 1923). In total probably 1 to 1.25 million people emigrated from 1800 to 1923. Furthermore, from 1923 to 1974 450 thousand emigrated out of Soigá. Using the above numbers this means from 1800 to 2016 more than 2.3 million people emigrated out of Soigá.
The main areas of settlements were the Americas, but other countries in Europe were popular destinations as well. Brazil, Argentina and the USA were all three nearly equally settled as much, by about 400 to 700 thousand each. The Soigans mainly settled in the cities or went to the countryside to work at large farms. Firrobatists often bought some land together to live according to the Firrobatist way freely. France, Germany, Spain, Italy and the UK were the most popular European countries to immigrate to, and together received around 120,000 Soigans from 1800 to 2016.
Diaspora[]
It is hard to estimate the exact number of people who can be counted to the Soigan diaspora. Thousands upon thousands of Soigans had left Soigá after the end of the Middle Ages in the Age of Exploration to the Americas as tradesmen and settlers on board of Portuguese, Spanish, French and English ships. Soigá had some colonies on itself in the Americas, mainly small islands in the Carribean but also some small land in Southern Central America, and here Soigan settlers had settled. What makes it so hard to calculate the diaspora of the descendents of these settlers is because no real data had been made at the time. However, estimates have been made by scholars that in the era of 1500 to 1800 200,000 to 500,000 Soigans have settled in the Americas. Using a population growth formula scholars think around 8 to 20 million people in the Americas (mainly South America) can trace their ancestry back to these group of Soigans. This range is quite large, as there just isn't enough reliable data to count on.
Descendants of the Soigan emigrants in the time period of 1800 to 2016 (factoring in that the most emigrants left Soigá prior of the proclamation of the Republic, and as well as some returning back to Soigá) number around 5 million. Of these, the American census reveals that about 1.0 million Americans say that their etnicity is Soigan American (TBD). Estimated is that there are around 1.6 million Brazilians that have roots in this emigration wave, while including the Soigan settlers before 1800 the number of Soigan Brazilians (TBD) could be as high as 7 to 12 million. Soigan Argentines (TBD) number around 1.3 million, but including the Soigan settlers before 1800 it could be much higher as well (around 3 to 5 million). The Soigan diaspora in all other nations combined counts some 1.2 million. Of the total 5 million people counting Soigan diaspora, around 170,000 have a Soigan passport (about 3.4%). Furthermore, an estimated 2 million people are eligible for Soigan citizenship (if you have atleast one parent or two grandparents who were born on Soigan soil, you can claim Soigan citizenship).
Besides that part of the diaspora, there is also a large Milatese diaspora. They have their ancestry from the Milatese population that resettled in mainly Spain, Portugal, Morocco, Algeria and Tunisia. The Milatians were largely Catholic, and were discriminated for a long time in mainly Muslim Northern Africa. They formed an influential minority due to their inherited elite position (they were made to be the elite in the Milatese Age). However, this caused also prejudice and hate towards them. Many expulsions and killings had happened for those who hadn't assimilated yet. Milatese minorities in Morocco, Algeria, Tunisia and Libya respond to about 0.1 to 0.5 million people. The numbers are discutable, as a large part of North Africans have partial ancestry, and finding the exact number of people who identify as Milatese is difficult. In Italy there is a small minority of Milatians of about 4,000 people, in Sicily. They speak a sub dialect of Milatese Olfkin. In the Besteriran regio in Spain and Portugal (roughly South Galicia and North East Portugal) there is a large Milatese minority of about 1.9 million people. They speak Besteriran, a language closely related but different from Olfkin. Besteriran is descended from a Milatese dialect of Olfkin. Besteriran is the only language being in the same language family as Olfkin, and is classified as a daughter language of Olfkin. The Besteriran minority battles for minority rights in Spain, and some argue even for independence. Spain has often accused Soigá of funding groups which, according to Spain, "threaten Spain's souvereignity".